周二發布的最新消費物價指數報告顯示,11月,美國通脹率同比漲幅從前一個月的7.7%下降到7.1%。但在某些城市,通脹上漲速度更快,因為商品和服務價格上漲以及房價上漲存在地區差異。
個人理財網站WalletHub的最新報告顯示,在鳳凰城,本地年通脹率為12.1%,最近一個月與兩個月前相比上漲了1.4%,這遠高于美國的任何其他大型城市。
為了確定各城市的排名,WalletHub研究了23個大都市區的消費物價指數,跟蹤有可用數據的最近一個月通脹與兩個月前和12個月前相比發生的變化。
在邁阿密,通脹同比上漲了10.1%。最近一個月與兩個月前相比,通脹上漲了0.9%。其次是另外一個佛羅里達州城市坦帕,通脹同比上漲了9.6%,較兩個月前上漲了1%。
亞特蘭大的通脹同比上漲了10.7%,較兩個月前上漲了0.5%。西雅圖排在第五位,通脹同比上漲了8.9%。與兩個月前相比,西雅圖的物價上漲了1%。
與此同時,一些城市最近一個月的通脹與兩個月前相比有所下降。在六個城市,該指標有所下降,其中之一是休斯敦,通脹下降了0.6%。但其同比通脹率依舊上漲了7.6%。
在過去幾個月,通脹有所下降的其他五個城市分別是洛杉磯、芝加哥、圣地亞哥、檀香山和明尼阿波利斯。這些城市的通脹降幅在0.10%至1%之間。
根據WalletHub的新報告,以下是通脹上漲幅度最大和最小的五個城市。
通脹上漲幅度最大
最近一個月與兩個月前相比,最近一個月與去年同期相比:
1. 鳳凰城:1.4%,12.1%
2. 邁阿密:0.9%,10.1%
3. 坦帕:1%,9.6%
4. 亞特蘭大:0.5%,10.7%
5. 西雅圖:1%,8.9%
通脹上漲幅度最小
最近一個月與兩個月前相比,最近一個月與去年同期相比:
19. 洛杉磯:-0.1%,6%
20. 芝加哥:-0.4%,6.8%
21. 圣地亞哥:-0.7%,6.7%
22. 檀香山:-0.6%,5.8%
23. 明尼阿波利斯:-1%,5.3%(財富中文網)
翻譯:劉進龍
審校:汪皓
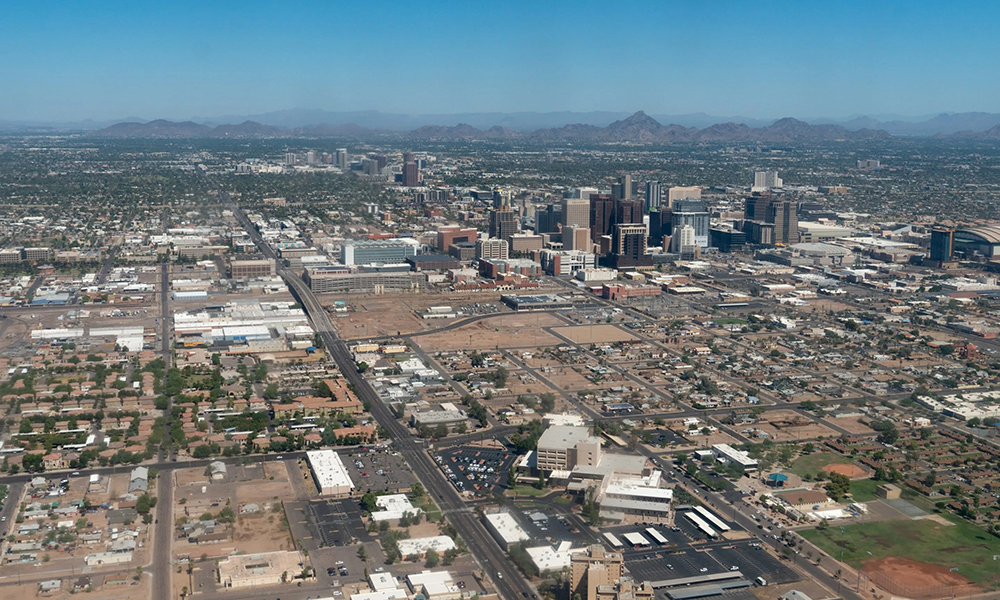
鳳凰城。攝影:MARLI MILLER/UNIVERSAL IMAGES GROUP ——蓋蒂圖片社
周二發布的最新消費物價指數報告顯示,11月,美國通脹率同比漲幅從前一個月的7.7%下降到7.1%。但在某些城市,通脹上漲速度更快,因為商品和服務價格上漲以及房價上漲存在地區差異。
個人理財網站WalletHub的最新報告顯示,在鳳凰城,本地年通脹率為12.1%,最近一個月與兩個月前相比上漲了1.4%,這遠高于美國的任何其他大型城市。
為了確定各城市的排名,WalletHub研究了23個大都市區的消費物價指數,跟蹤有可用數據的最近一個月通脹與兩個月前和12個月前相比發生的變化。
在邁阿密,通脹同比上漲了10.1%。最近一個月與兩個月前相比,通脹上漲了0.9%。其次是另外一個佛羅里達州城市坦帕,通脹同比上漲了9.6%,較兩個月前上漲了1%。
亞特蘭大的通脹同比上漲了10.7%,較兩個月前上漲了0.5%。西雅圖排在第五位,通脹同比上漲了8.9%。與兩個月前相比,西雅圖的物價上漲了1%。
與此同時,一些城市最近一個月的通脹與兩個月前相比有所下降。在六個城市,該指標有所下降,其中之一是休斯敦,通脹下降了0.6%。但其同比通脹率依舊上漲了7.6%。
在過去幾個月,通脹有所下降的其他五個城市分別是洛杉磯、芝加哥、圣地亞哥、檀香山和明尼阿波利斯。這些城市的通脹降幅在0.10%至1%之間。
根據WalletHub的新報告,以下是通脹上漲幅度最大和最小的五個城市。
通脹上漲幅度最大
最近一個月與兩個月前相比,最近一個月與去年同期相比:
1. 鳳凰城:1.4%,12.1%
2. 邁阿密:0.9%,10.1%
3. 坦帕:1%,9.6%
4. 亞特蘭大:0.5%,10.7%
5. 西雅圖:1%,8.9%
通脹上漲幅度最小
最近一個月與兩個月前相比,最近一個月與去年同期相比:
19. 洛杉磯:-0.1%,6%
20. 芝加哥:-0.4%,6.8%
21. 圣地亞哥:-0.7%,6.7%
22. 檀香山:-0.6%,5.8%
23. 明尼阿波利斯:-1%,5.3%(財富中文網)
翻譯:劉進龍
審校:汪皓
Phoenix.
The latest consumer price index report on Tuesday showed that year-over-year inflation in the U.S. slowed to 7.1% in November from 7.7% a month earlier. But inflation is rising more quickly in some cities than in others because rising prices for goods and services, along with housing, varies by geography.
In Phoenix, local annual inflation of 12.1%—or a 1.4% gain in the latest month versus two months prior—is higher than in any other major city in the country, according to personal finance website WalletHub’s new report.
To determine its rankings, WalletHub looked at the consumer price index for 23 metropolitan areas to track the change in inflation from the latest month of available data versus two months earlier, and from the latest month to 12 months earlier.
In Miami inflation rose to 10.1% versus a year before. As for the latest month versus two months earlier, inflation was up 0.9%. The fellow Florida city of Tampa followed, with an inflation rate of 9.6% compared to a year earlier and 1% higher than two months ago.
Atlanta came next, with inflation of 10.7% year-over-year and 0.5% from two months earlier. Seattle took the fifth spot with year-over-year inflation of 8.9%. Compared to two months earlier, the city’s prices were up 1%.
Meanwhile, some cities have seen inflation drop in the latest month versus two months earlier. Houston was among six cities that experienced a decrease by this measure—in its case falling 0.6%. Still its year-over-year inflation rose 7.6%.
The other five cities where inflation declined in the past few months was Los Angeles, Chicago, San Diego, Honolulu, and Minneapolis. All of their declines ranged from 0.10% to 1%.
Here are the five cities where inflation is rising the most and least, according to WalletHub’s new report.
Rising the most
Latest month versus two months prior, latest month versus the previous year:
1. Phoenix: 1.4%, 12.1%
2. Miami: 0.9%, 10.1%
3. Tampa: 1%, 9.6%
4. Atlanta: 0.5%, 10.7%
5. Seattle: 1%, 8.9%
Rising the least
Latest month versus two months prior, latest month versus the previous year
19. Los Angeles: -0.1%, 6%
20. Chicago: -0.4%, 6.8%
21. San Diego: -0.7%, 6.7%
22. Honolulu: -0.6%, 5.8%
23. Minneapolis: -1%, 5.3%


