還記得2月初的狀況嗎?股市屢創新高,失業率處于50年來的最低水平,冠狀病毒還是地球另一端的一種新型病癥。
現在的世界已經大不相同了。
現在的問題不只是經濟會衰退得多么嚴重,而是我們是否正走向經濟學中最“骯臟”的狀態:大蕭條。
為了更好地判斷經濟走向,《財富》雜志調查了7個最重要的經濟指標。由于此次大流行病期間的狀況瞬息萬變,且3月中旬大流行病對美國經濟產生了重大影響,所以我們只選取了與當時數據相關的指標。(失業率和住房建設等一些指標的信息相對滯后,所以要到今年春季晚些時候才能看到冠狀病毒對這些指標的全面影響。)
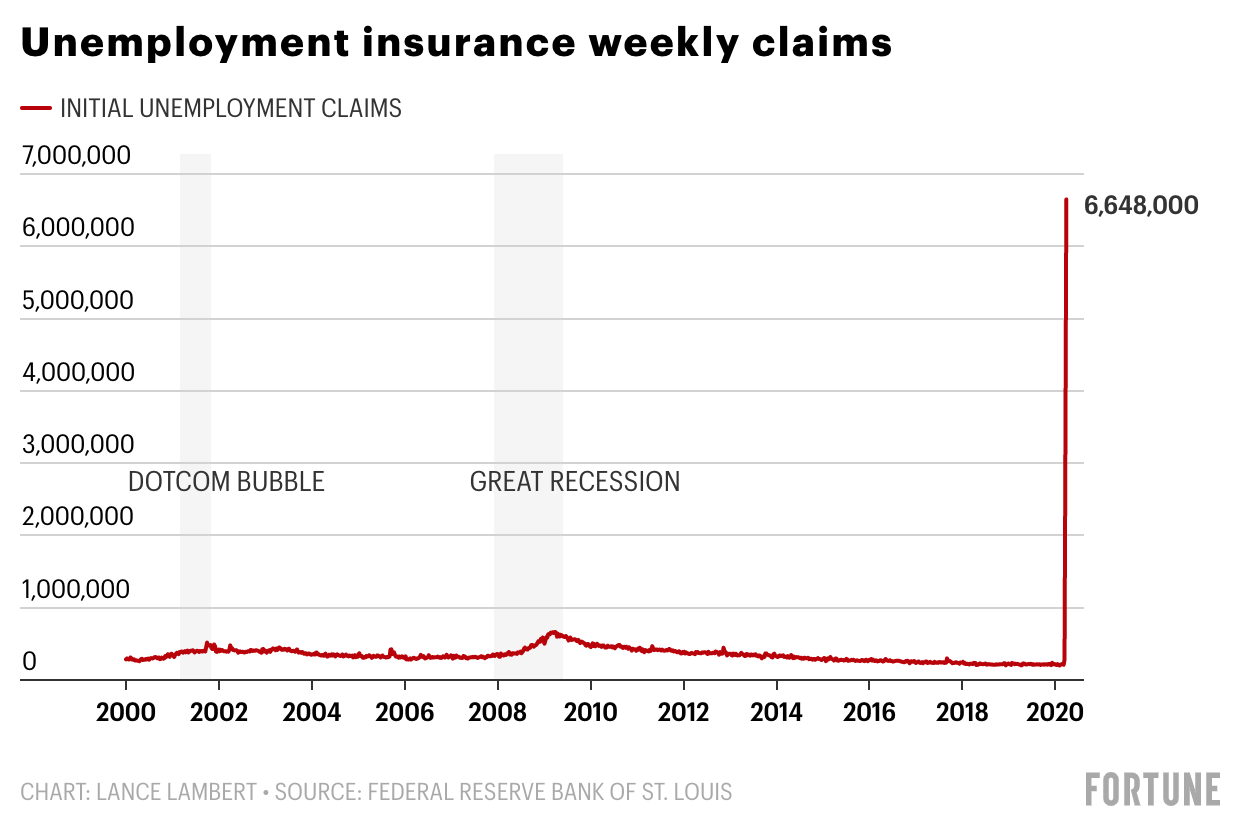 圖:從2000年到2020年,每周首次申請失業救濟金的人數。數據來源:圣路易斯聯邦儲備銀行
截至3月28日,當周已有超過660萬的美國人申請了失業救濟金。失業率達到了有史以來的最高值,打破了截至3月21日當周創下的近330萬失業救濟金申請人數的歷史最高記錄。在這兩周內,共有1000萬人申請了失業救濟金。
申請失業救濟的人數激增,導致各州難以及時為所有人辦理手續——也就是說,申請失業救濟金的總人數其實還要更多。
在公布失業救濟金申請狀況之前,截至3月中旬的最新就業報告顯示,共有710萬的美國人已處于失業狀態。如果把就業報告中的美國失業人數和隨后兩周中首次申請失業救濟的人數加在一起,那么美國的失業人數已經超過了1700萬——這將成為美國歷史上的最高值。
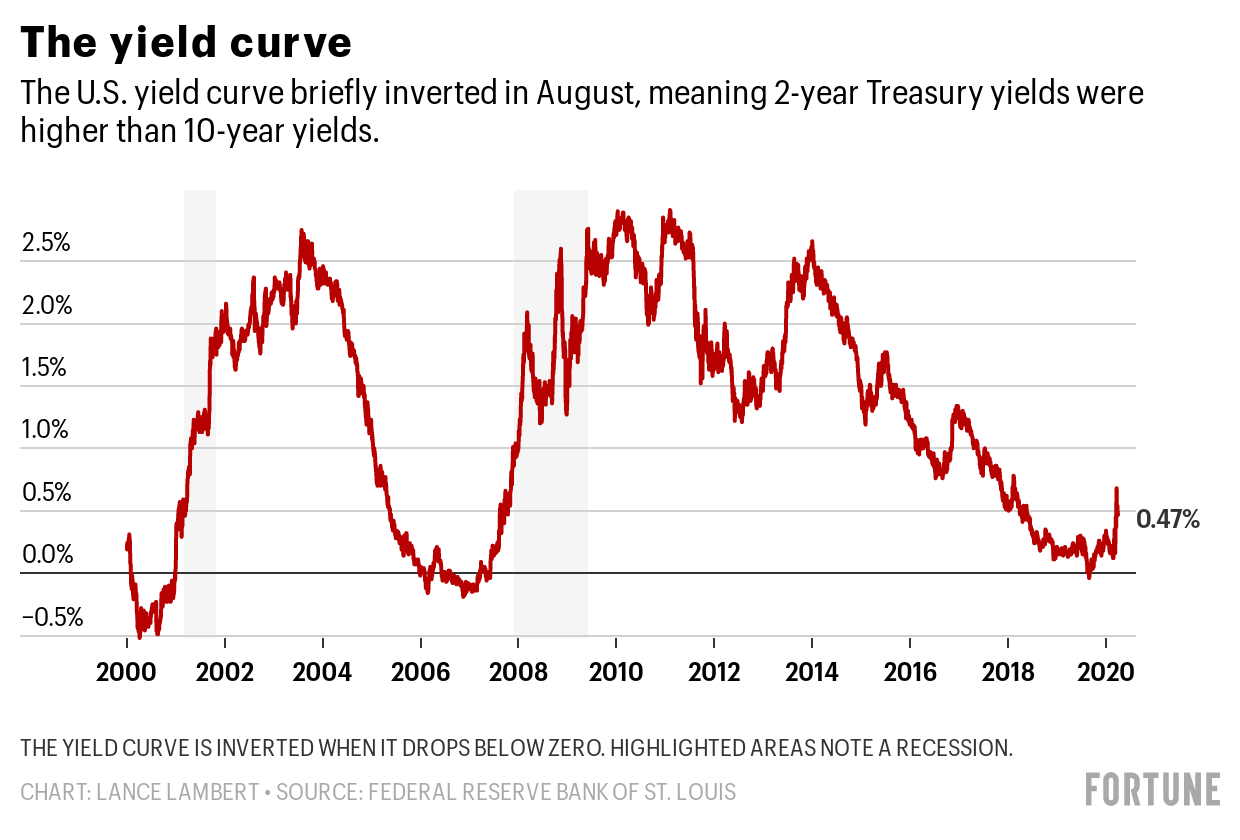 圖:2000-2020年收益率曲線。美國的收益率曲線在8月時出現了短暫的倒掛現象,這意味著2年期國債收益率高于10年期國債收益率。收益率曲線倒掛,收益率差變為負值。突出顯示的區域為經濟衰退時期。數據來源:圣路易斯聯邦儲備銀行
2019年8月收益率曲線倒掛,意味著長期利率暫時低于短期利率。從歷史角度來看,這種現象通常發生在經濟衰退之前。從8月再往后,倒掛現象已逐漸消失。但是事實上,出現倒掛即意味著早在新型冠狀病毒爆發以前,人們就已經對經濟產生了一些憂慮。
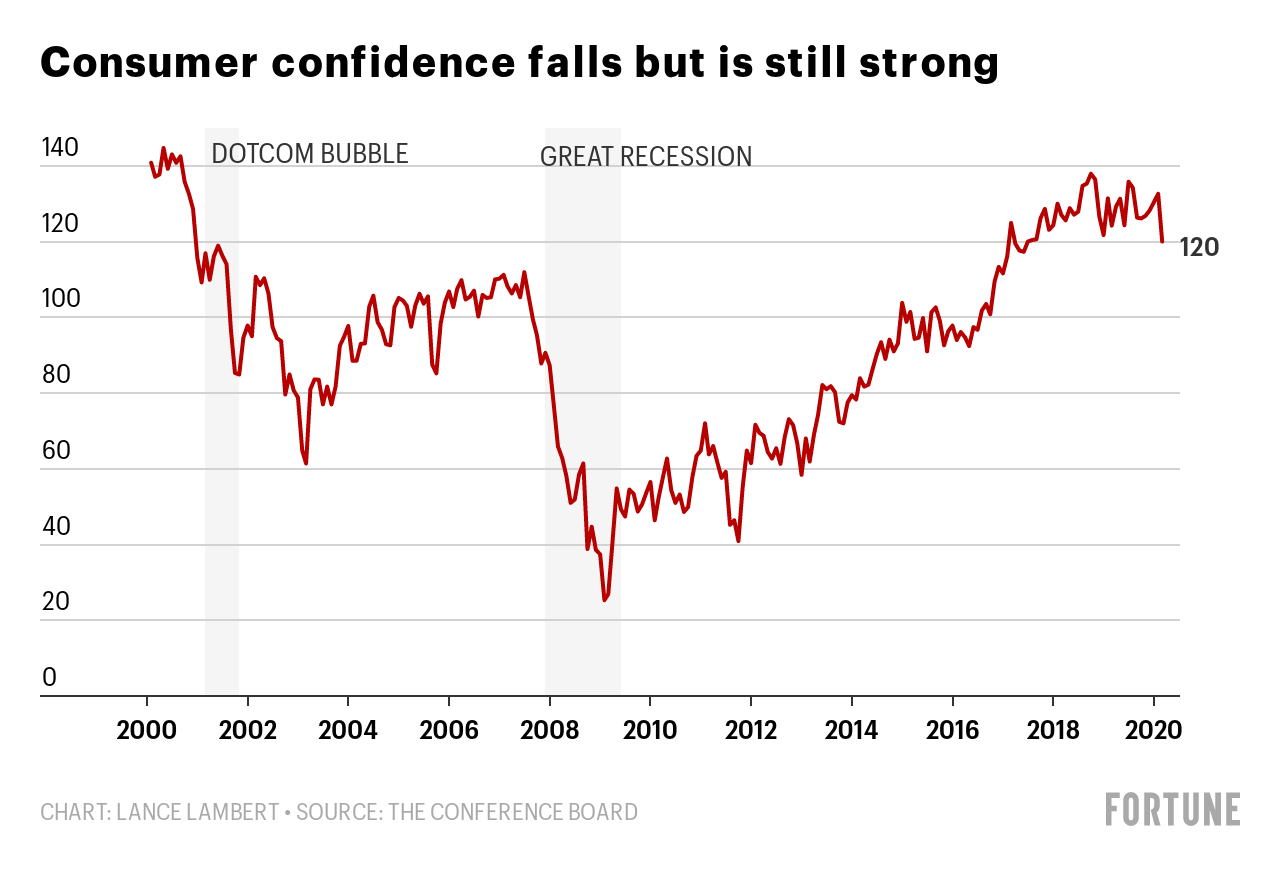 圖:消費者信心有所下滑但依然強勁。數據來源:美國經濟咨商局
 美國經濟咨商局統計的消費者信心指數顯示,3月份消費者信心有所下滑。當月指數為120,低于2月份的132.6。雖然消費者信心下滑到了2017年的數值,但仍遠高于大蕭條時期的數值。
美國經濟咨商局的經濟指標高級主管萊恩·弗朗哥在新聞稿中表示:“3月份消費者信心的下滑符合經濟嚴重收縮的狀況——而非暫時的沖擊——接下來必定還會繼續下滑。”
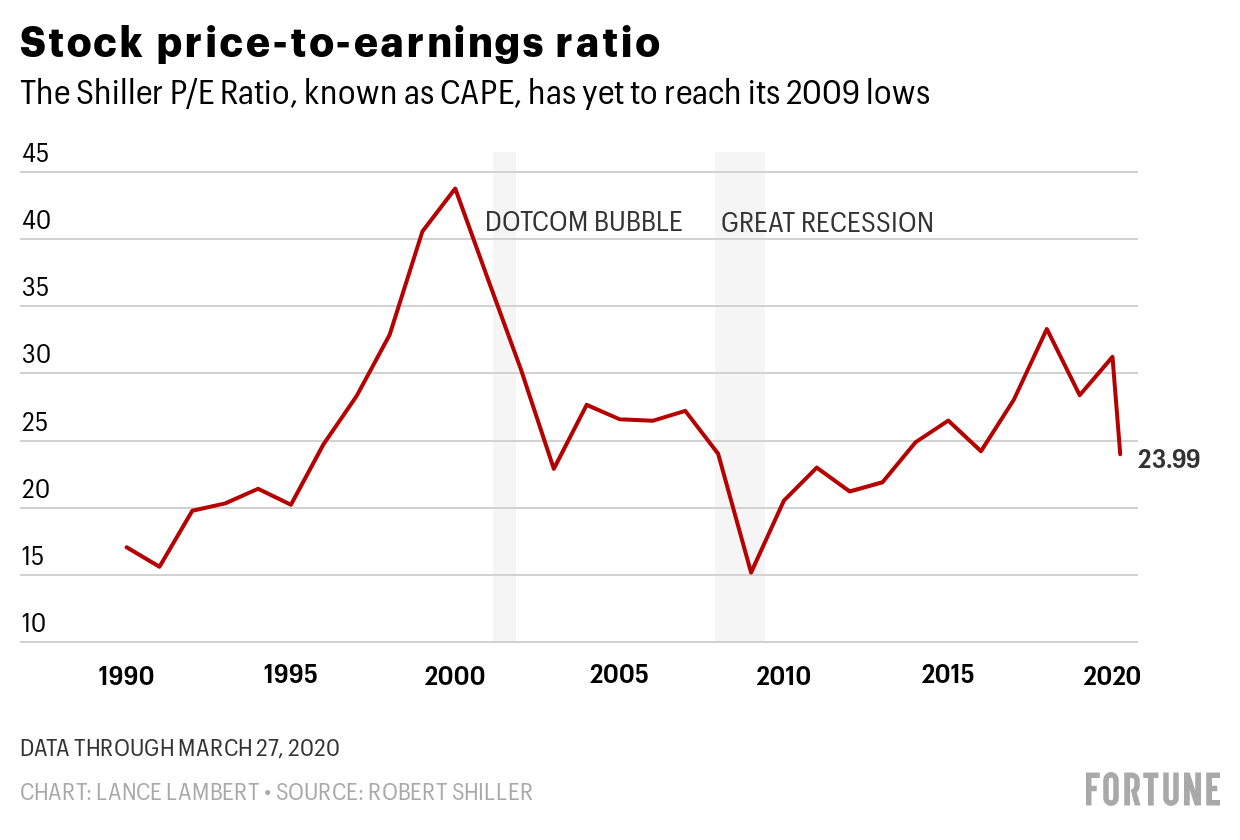 圖:股票價格收益率。席勒市盈率(CAPE)已降至與2009年相當的低值。數據來源:羅伯特·希勒
今年早些時候,席勒市盈率升至歷史高位,證明股市估值過高。從那時起,熊市開始,該指數逐步下跌。不過,其下跌情況可能看起來還不算嚴重,等我們拿到收益報表之后,將會看出明顯的下降趨勢——因為這是基于以前較高的利潤得出的,所以當前的市盈率看上去較低。不管怎樣,市盈率仍高于2009年的水平;也就是說,如果經濟進一步衰退,市場仍有較大的彈性空間。
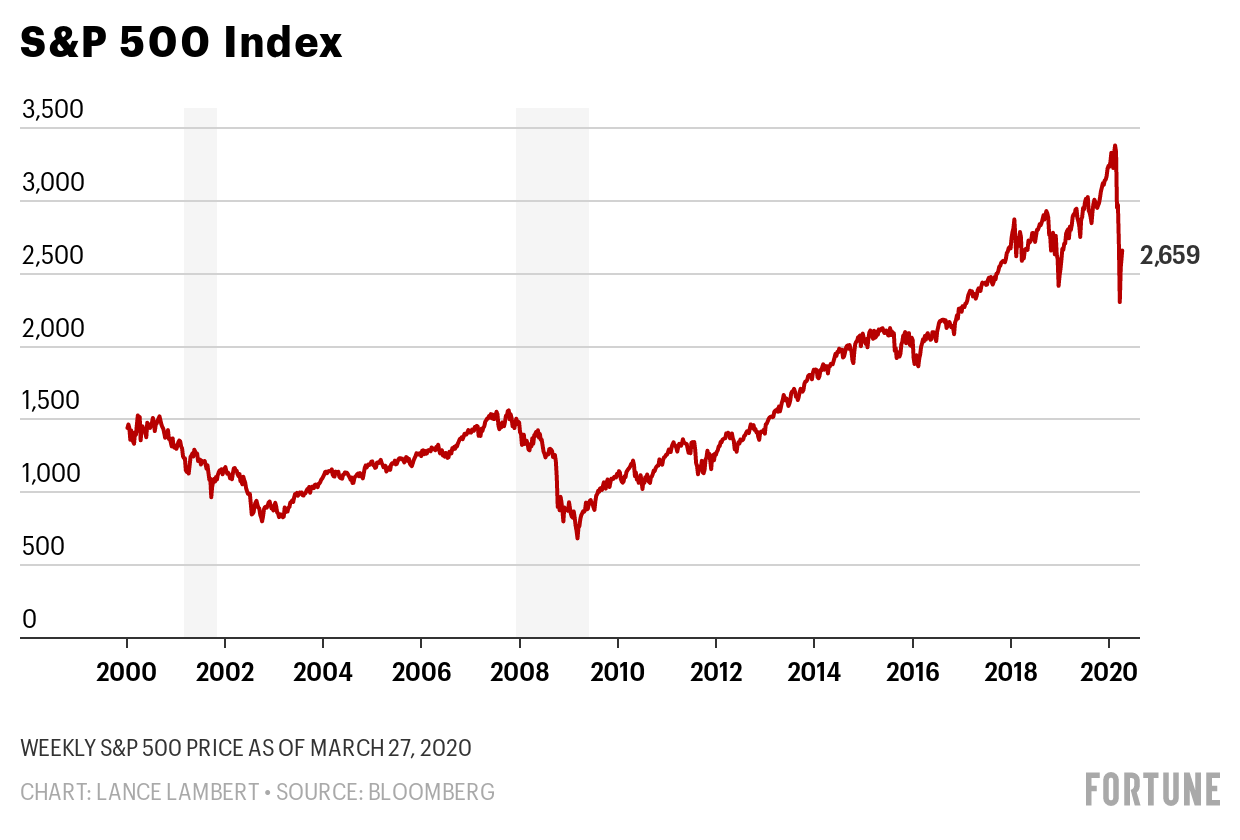 圖:標準普爾500指數。數據來源:彭博社
由于持續11年的牛市變為熊市,過去的一個月對華爾街來說可謂是相當殘酷。標準普爾500指數從2月份的3386點高值跌至2237點,跌幅達到了34%。目前該指數有所回升,但此次下跌是個糟糕的訊號。在近代歷史上,類似規模的下跌通常會伴隨著經濟衰退。最出名的案例是2000年羅素2000指數和其它一些指數的崩盤,它們就是預示了2001年經濟大蕭條的危險信號。
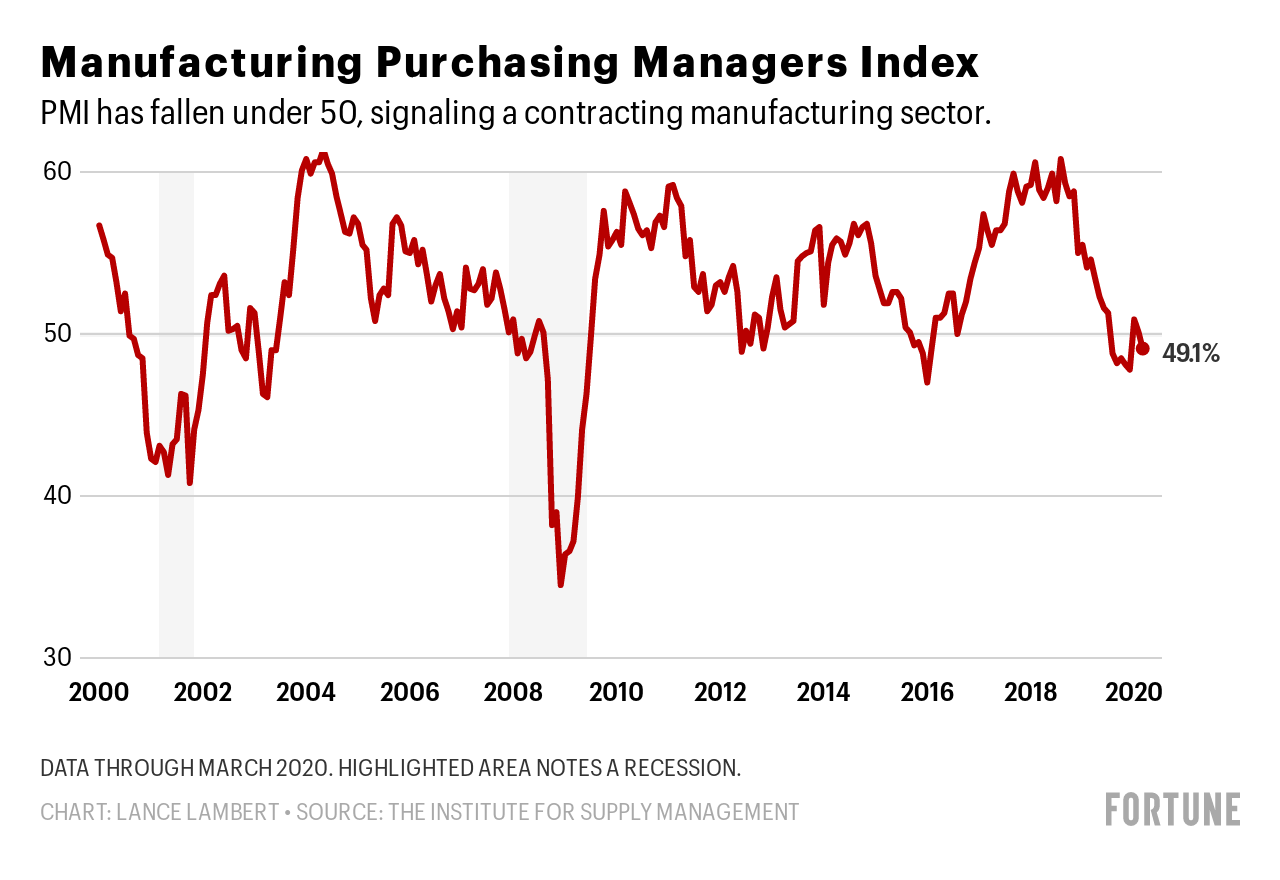 圖:制造業采購經理人指數。該指數目前已降到50以下,標志著制造業緊縮。數據來源:美國供應管理協會
甚至早在冠狀病毒爆發之前,美國制造業就已呈現出了萎靡不振的態勢,并在去年年底屢次緊縮。美國供應管理協會3月份公布的采購經理人指數為49.1%,低于2月份的50.1%。采購經理人指數低于50%則表明制造業處于緊縮狀態,而這種情況在過去一年中已經發生了6次。不過,這種較為平緩的下滑趨勢還不如其它許多行業那么糟糕。這是因為俄亥俄與賓夕法尼亞等州認為制造工廠是不可或缺的,并允許它們繼續運營。一些與醫療保健行業有關的工廠和平時一樣忙碌,也是它們提升了口罩等產品的產量。
 圖:高盛投資公司修改后的2020年季度GDP預測。數據來源:高盛投資公司
 在2019年的最后一個季度,美國經濟增長數值為2.1%。高盛投資公司在3月20日發布的GDP預測內容顯示,平緩的增幅可能很快就會被迅速下滑的數值所顛覆。考慮到幾周以來已經有1000萬美國人申請失業救濟金,這樣的預測可能還是太保守了。
上個季度,我們制作了一張經濟指標評分卡(綠色表示增長,黃色表示穩定,紅色表示預警)。本季度的數據只有一種顏色:紅色,或是逐漸變為紅色。
2020年的經濟軌跡明顯指向經濟衰退。大流行病消除后,具體措施的深度和持續時間將決定美國經濟會受到怎樣的損害。(財富中文網)
譯者:殷圓圓
還記得2月初的狀況嗎?股市屢創新高,失業率處于50年來的最低水平,冠狀病毒還是地球另一端的一種新型病癥。
現在的世界已經大不相同了。
現在的問題不只是經濟會衰退得多么嚴重,而是我們是否正走向經濟學中最“骯臟”的狀態:大蕭條。
為了更好地判斷經濟走向,《財富》雜志調查了7個最重要的經濟指標。由于此次大流行病期間的狀況瞬息萬變,且3月中旬大流行病對美國經濟產生了重大影響,所以我們只選取了與當時數據相關的指標。(失業率和住房建設等一些指標的信息相對滯后,所以要到今年春季晚些時候才能看到冠狀病毒對這些指標的全面影響。)
截至3月28日,當周已有超過660萬的美國人申請了失業救濟金。失業率達到了有史以來的最高值,打破了截至3月21日當周創下的近330萬失業救濟金申請人數的歷史最高記錄。在這兩周內,共有1000萬人申請了失業救濟金。
申請失業救濟的人數激增,導致各州難以及時為所有人辦理手續——也就是說,申請失業救濟金的總人數其實還要更多。
在公布失業救濟金申請狀況之前,截至3月中旬的最新就業報告顯示,共有710萬的美國人已處于失業狀態。如果把就業報告中的美國失業人數和隨后兩周中首次申請失業救濟的人數加在一起,那么美國的失業人數已經超過了1700萬——這將成為美國歷史上的最高值。圖:2000-2020年收益率曲線。美國的收益率曲線在8月時出現了短暫的倒掛現象,這意味著2年期國債收益率高于10年期國債收益率。收益率曲線倒掛,收益率差變為負值。突出顯示的區域為經濟衰退時期。數據來源:圣路易斯聯邦儲備銀行
2019年8月收益率曲線倒掛,意味著長期利率暫時低于短期利率。從歷史角度來看,這種現象通常發生在經濟衰退之前。從8月再往后,倒掛現象已逐漸消失。但是事實上,出現倒掛即意味著早在新型冠狀病毒爆發以前,人們就已經對經濟產生了一些憂慮。圖:消費者信心有所下滑但依然強勁。數據來源:美國經濟咨商局
美國經濟咨商局統計的消費者信心指數顯示,3月份消費者信心有所下滑。當月指數為120,低于2月份的132.6。雖然消費者信心下滑到了2017年的數值,但仍遠高于大蕭條時期的數值。
美國經濟咨商局的經濟指標高級主管萊恩·弗朗哥在新聞稿中表示:“3月份消費者信心的下滑符合經濟嚴重收縮的狀況——而非暫時的沖擊——接下來必定還會繼續下滑。”圖:股票價格收益率。席勒市盈率(CAPE)已降至與2009年相當的低值。數據來源:羅伯特·希勒
今年早些時候,席勒市盈率升至歷史高位,證明股市估值過高。從那時起,熊市開始,該指數逐步下跌。不過,其下跌情況可能看起來還不算嚴重,等我們拿到收益報表之后,將會看出明顯的下降趨勢——因為這是基于以前較高的利潤得出的,所以當前的市盈率看上去較低。不管怎樣,市盈率仍高于2009年的水平;也就是說,如果經濟進一步衰退,市場仍有較大的彈性空間。圖:標準普爾500指數。數據來源:彭博社
由于持續11年的牛市變為熊市,過去的一個月對華爾街來說可謂是相當殘酷。標準普爾500指數從2月份的3386點高值跌至2237點,跌幅達到了34%。目前該指數有所回升,但此次下跌是個糟糕的訊號。在近代歷史上,類似規模的下跌通常會伴隨著經濟衰退。最出名的案例是2000年羅素2000指數和其它一些指數的崩盤,它們就是預示了2001年經濟大蕭條的危險信號。
甚至早在冠狀病毒爆發之前,美國制造業就已呈現出了萎靡不振的態勢,并在去年年底屢次緊縮。美國供應管理協會3月份公布的采購經理人指數為49.1%,低于2月份的50.1%。采購經理人指數低于50%則表明制造業處于緊縮狀態,而這種情況在過去一年中已經發生了6次。不過,這種較為平緩的下滑趨勢還不如其它許多行業那么糟糕。這是因為俄亥俄與賓夕法尼亞等州認為制造工廠是不可或缺的,并允許它們繼續運營。一些與醫療保健行業有關的工廠和平時一樣忙碌,也是它們提升了口罩等產品的產量。圖:高盛投資公司修改后的2020年季度GDP預測。數據來源:高盛投資公司
在2019年的最后一個季度,美國經濟增長數值為2.1%。高盛投資公司在3月20日發布的GDP預測內容顯示,平緩的增幅可能很快就會被迅速下滑的數值所顛覆。考慮到幾周以來已經有1000萬美國人申請失業救濟金,這樣的預測可能還是太保守了。
上個季度,我們制作了一張經濟指標評分卡(綠色表示增長,黃色表示穩定,紅色表示預警)。本季度的數據只有一種顏色:紅色,或是逐漸變為紅色。
2020年的經濟軌跡明顯指向經濟衰退。大流行病消除后,具體措施的深度和持續時間將決定美國經濟會受到怎樣的損害。(財富中文網)
譯者:殷圓圓
Remember early February? The stock market was notching new highs, the unemployment rate was at a 50-year low, and the coronavirus was an emerging strain of disease halfway around the world.
The world couldn't look more different now.
Now the question isn't just how deep a recession will be, it's whether we're heading for the dirtiest word in all of economics: a depression.
To best judge which way the economy is going, Fortune canvassed seven top economic indicators. Because things are changing so rapidly during this pandemic, we looked only at indicators that include data as of mid-March, when the pandemic was substantially affecting the U.S. economy. (Some indicators like the unemployment rate and home construction are lagging, so we won't see the full effects of the coronavirus on those till later this spring.)
More than 6.6 million Americans filed for unemployment benefits in the week ending March 28. That is the highest number ever, topping the previous all-time record of almost 3.3 million unemployment claims, which was set the week ending March 21. Combined, that's 10 million jobless claims in two weeks.
This surge in unemployment claims is so great that states are struggling to process everyone—meaning the total number of claims is actually higher.
Before these unemployment claims, a total of 7.1 million Americans were unemployed in the most recent jobs report through mid-March. But if you combine the number of Americans unemployed in the jobs report and the following two weeks of unemployment claims, then the country's jobless amounts to above 17 million—which would be the highest in American history.
Back in August 2019 the yield curve inverted, which means long-term rates were temporarily lower than short-term rates. Historically, this usually happens before a recession. Since then, the inversion has receded. But the fact it inverted means there was already some concern in the economy even before COVID-19.
Consumer confidence dropped in March, according to the Conference Board's Consumer Confidence Index. The index was at 120, down from 132.6 in February. While this drop moves consumer confidence back to 2017 levels, it is still far above where it was during the Great Recession.
"March’s decline in confidence is more in line with a severe contraction—rather than a temporary shock—and further declines are sure to follow,” said Lynn Franco, senior director of economic indicators at the Conference Board in its press release.
Earlier this year the Shiller P/E ratio was starting to get historically high, indicating an overvalued stock market. Since then, we've entered into a bear market, and the index has dropped. But this drop might be less than it appears, considering earnings will be down significantly once we get earning reports—so current P/E ratios look lower since they're based on previous higher profits. Either way, the P/E ratio is still above that of 2009, meaning the market still has room for bigger losses if the downturn deepens.
The past month has been brutal on Wall Street, as an 11-year bull run turned into a bear market. The S&P 500 dropped 34% from its February high of 3,386 to 2,237 in March. It has since recovered a bit, but this drop is a bad omen. In recent history, similar-size drops have usually been followed by recessions. One of the best examples is the Russell 2000 and other indexes that crashed in 2000 and were the red flag leading up to the 2001 recession.
Even before the coronavirus outbreaks, U.S. manufacturing was already lethargic, contracting several times late last year. The Institute for Supply Management’s Purchasing Managers Index (PMI) came in at 49.1% in March, down from 50.1% in February. A PMI below 50% signals a contracting manufacturing sector—something that has happened six times over the past year. But that mild dip isn't as bad as many other industries. The reason is that states like Ohio and Pennsylvania have deemed manufacturers essential and allowed them to stay open. And some manufacturers with ties to the health care industry are as busy as ever, as they ramp up production of items like masks.
The U.S. grew at 2.1%. in the final quarter of 2019. That modest growth could soon be upended by sharp decreases, according to Goldman Sach's GDP forecast released March 20. And given the 10 million Americans who've claimed unemployment in the weeks since, that forecast might be too conservative.
Last quarter we provided a scorecard for the economic indicators (green=signaling growth, yellow=steady, and red=forewarning trouble). This quarter the data scream only one color: red or trending red.
The trajectory of the economy in 2020 is clearly pointing toward a recession. The specifics—how deep, how long—will dictate the damage done to the U.S. economy once the pandemic recedes.


