股債齊漲,投資者該怎么看?

|
股票和債券市場正在同時上漲——目前來說是這樣。 市場在2019年上半年大幅上漲,但不能保證這種漲勢會在今年的剩余時間里持續下去。不過有一點可以肯定,那就是股債雙漲不是什么非同尋常的事。 截至6月底,標普500指數在2019年上漲了18.5%。彭博巴克萊美國綜合債券指數同期上漲6.1%,該指數代表了美國債券市場的整體走勢。今年上半年,60%美國股票加40%債券這樣的簡單投資組合的回報率為13.6%,創下自1997年上半年以來該組合的最好表現。 實際上,在1976年彭博巴克萊美國綜合債券指數誕生以來, 60%/40%股債組合在上半年出現兩位數漲幅的次數并不多,算上這次也只有11次。 有些投資者可能覺得股票和債券同時出現這樣的大行情很奇怪。但在1976年到現在的43年里,股債雙漲的年份共有32個。如果用5年期美國國債數據,我們還可進一步向前回溯。在二戰以來的74年里,美國股票和債券同時上漲的有50年,約占三分之二。 有些人覺得股票和債券應該走勢相反,所以上述情況是講不通的。但多樣化投資的全部意義就在于將不同市場環境下表現不同的資產組合到一起。問題是投資者經常弄不清楚如何看待投資組合中各種資產的相關性。大多數投資者都覺得應該持有負相關投資,也就是走勢相反的資產。但人們真正應該持有的是預期回報為正的組合,而且其中各類資產的相關性會根據市場環境而逐步變化。 如果兩項資產的相關性為1.0,就意味著其中一項資產的價格上漲時,另一項資產也會上漲;如果相關性為-1.0,則意味著一項資產上漲時,另一項資產就會下跌。相關性接近零則表示這兩種資產的價格變動之間幾乎沒有關系。而從長期來看,股票和債券之間的相關性正是如此。1945年以來,標普500指數與5年期國債的相關性為-0.1,也就是說兩者之間的表現幾乎沒有關聯。但這種關系會隨著時間的推移而改變,從下圖中的3年滾動相關性數據就可以看到這一點。 |
Stocks and bonds are moving higher together -- for now. The huge market gains in the first part of 2019 aren’t guaranteed to stick for the remainder of the year. But one thing is certain: It's not out of the ordinary for stocks and bonds to rise in concert with one another. Through the end of June, the S&P 500 was up 18.5% in 2019. The Bloomberg Barclays U.S. Aggregate Bond Index, a proxy for the broad U.S. bond market, was up 6.1% at the halfway point of the year. A simple 60/40 mix of U.S. stocks and bonds returned 13.6% through the first six months of the year, the best start for this portfolio since the first half of 1997. In fact, going back to the inception of the Aggregate Bond Index in 1976, this was just the eleventh time a 60/40 portfolio of stocks and bonds began the first half of the year up double digits. It may seem odd to some investors that both stocks and bonds could be up so much at the same time. Yet, since 1976, stocks and bonds have both gained in the same calendar year in 32 out of 43 years. We can take things back even further using data on 5-year treasury bonds. Since World War II, U.S. stocks and bonds have seen positive returns in 50 out of 74 years or roughly two-thirds of the time. This relationship might not make sense to those who assume stocks and bonds should move in different directions but the whole point of diversification is to combine assets that act differently during various market environments. The problem is investors often confuse how to think about correlations within a portfolio. Most investors assume you want to own negatively correlated investments that move in opposite directions. But what you really want is assets that have a positive expected return profile with correlations that change over time depending on the market environment. A correlation of 1.0 implies that when one asset rises so does the other asset while a correlation of -1.0 implies when one asset rises the other one falls. A correlation close to zero implies little relationship in price movements, which is exactly what things look like for stocks and bonds over the long haul. Since 1945, the S&P 500 and 5-year treasuries have a correlation of -0.1, meaning there is little relationship in how they perform. But this relationship changes over time as you can see from the rolling 3-year correlation numbers: |

|
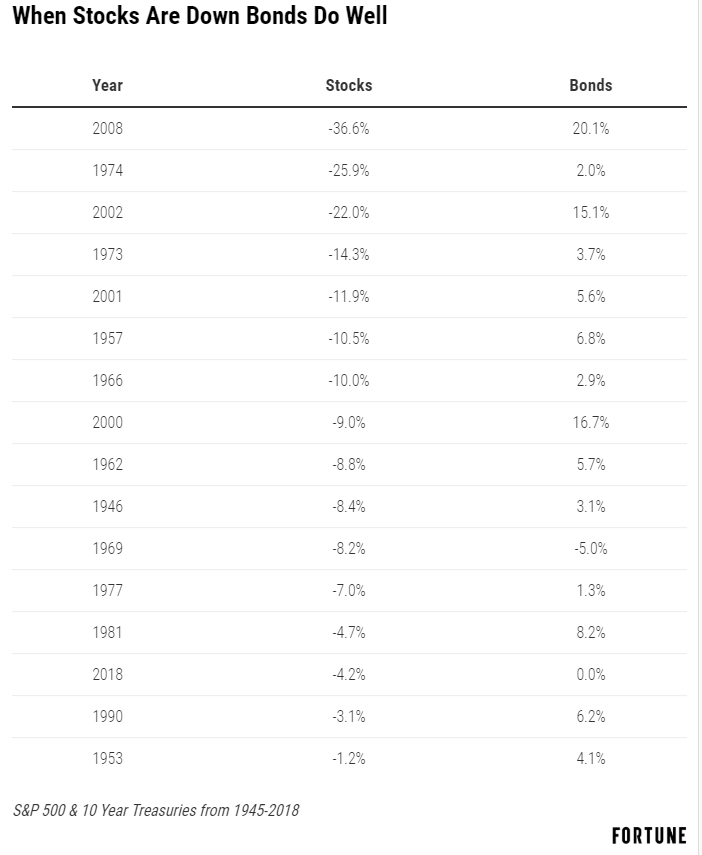
跟金融市場上幾乎所有其他東西一樣,股票和債券之間的關系一直在變,但這實際上是件好事。債券在投資組合中大放異彩的時刻不是股價上漲,而是股價下跌,只有在這種情況下,人們才會希望負相關性發揮作用。 在1945年以來的74年里,標普500指數有16年下跌,平均跌幅為11.7%。而在這些年份中,5年期美國國債有15年都是上漲的,平均漲幅為6.2%。上一次股債同時下跌出現在1969年,當時標普500指數下跌了8%以上,5年期國債跌幅則不到1%。 |
The relationship between stocks and bonds is anything but static, like nearly everything else in the financial markets but this is actually a good thing. The true time for bonds to shine in a portfolio is not when stocks are up but when they’re down, which is the only time you want that negative correlation to kick in. Since 1945, the S&P 500 has been down in 16 out of 74 years, with an average loss of -11.7%. In those down years, 5-year treasuries were positive 15 out of 16 times, with an average gain of 6.2%. The last time stocks and bonds were down in the same year was 1969, when the S&P fell more than 8% while 5-year treasuries were down less than 1%. |

|
在這種時候,債券就可以證明自己在投資組合中的價值了。市場震蕩時,債券能夠為投資者提供穩定性,讓他們有能力在股票下跌時補倉,或者把債市收益用于支出。 對于美國股票和債券投資者來說,2019年上半年差不多是最理想的階段,但這種情況不會永遠持續下去。好消息是,當股市不可避免地回落時,債券往往能夠為他們遮風擋雨。(財富中文網) 譯者:艾倫 審校:夏林 |
This is when bonds prove their worth in a portfolio, offering investors stability during times of volatility and the ability to rebalance into falling stocks or use bond proceeds for spending needs. The first half of 2019 was about as good as it gets for investors in U.S. stocks and bonds. That won’t last forever. The good news is when the inevitable setback occurs in stocks, bonds tend to provide some shelter from the storm. |


